Quick Answer (TL;DR)
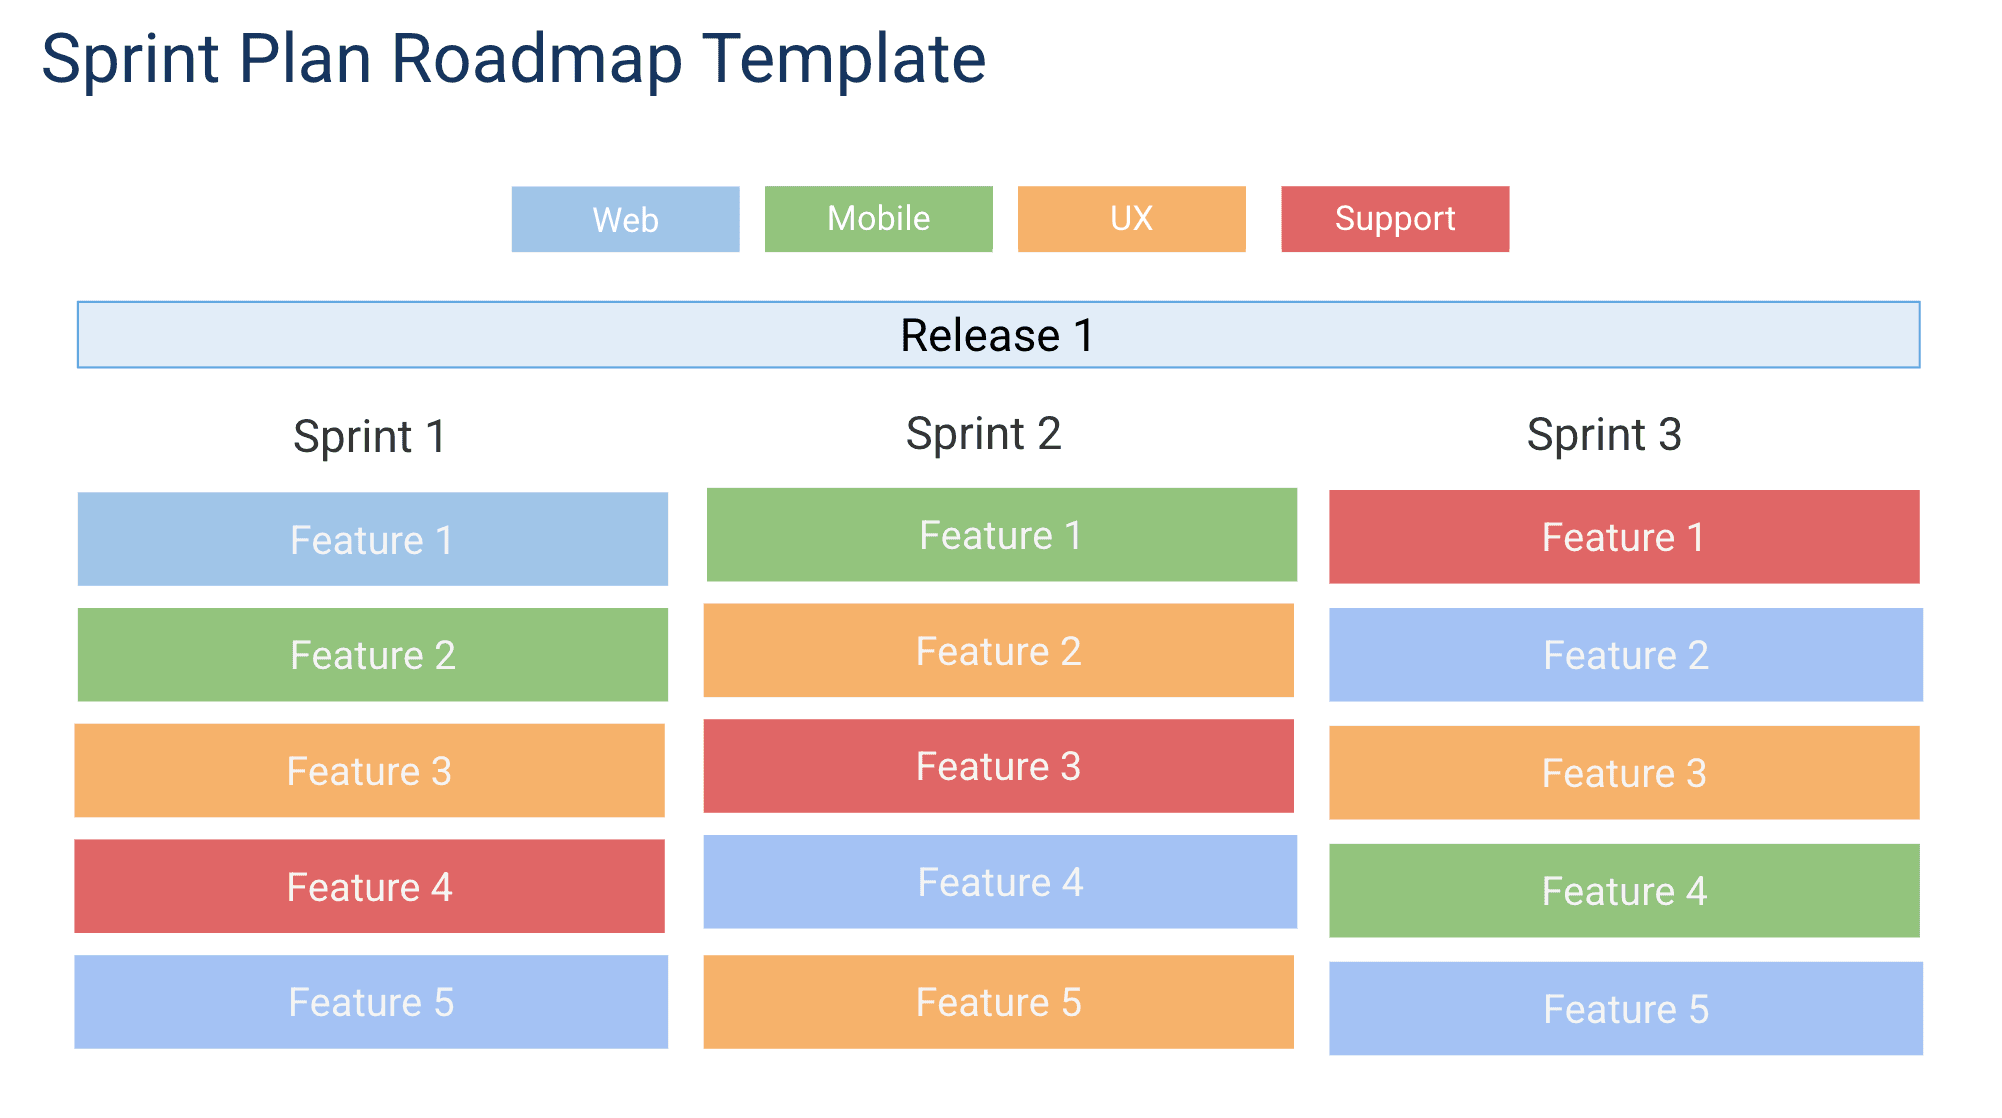
This free Google Slides sprint plan roadmap template helps you present sprint goals, story assignments, and team capacity in a clean visual format. Use it for sprint planning kick-offs, sprint reviews, and stakeholder updates -- turning your sprint data into a narrative that the whole organization can follow.
What This Template Includes
Why Use Google Slides for Sprint Planning
Sprint data lives in your project management tool, but sprint communication happens in meetings. Google Slides bridges that gap by turning sprint data into a presentation that structures the conversation.
For sprint planning kick-offs, a Slides deck forces the team to articulate a clear sprint goal rather than just pulling stories from the backlog. The act of putting the goal on a slide makes it concrete and shared.
For sprint reviews, the slide format lets you tell a story: here is what we committed to, here is what we shipped, here is the impact. This narrative structure is more engaging than walking through a Jira board with 40 tickets.
Template Structure
Sprint Goals
Every sprint should have a goal that describes the outcome the team is working toward, not just a list of tickets to complete. The sprint goal is a single sentence that answers the question: "If this sprint goes perfectly, what will be true at the end that is not true today?" Examples include "Users can complete checkout without leaving the app" or "API response times drop below 200ms for the top 10 endpoints." The template places the sprint goal prominently on the first slide so that when the team faces a trade-off during the sprint, they can ask which option better serves the goal.
Backlog Allocation
The backlog allocation section shows the product backlog on the left and upcoming sprints on the right. Items are pulled from the backlog into a specific sprint during sprint planning. Each item carries its title, story point estimate, assigned team member, and acceptance criteria. The template supports three priority lanes: committed (will be done this sprint), stretch (will be attempted if committed work finishes early), and deferred (explicitly pushed to a future sprint). In Google Slides, use distinct card styles or borders for each lane. This three-lane model prevents the common failure of overpacking a sprint and then feeling like the team failed when predictable stretch items were not completed.
Velocity Tracking
Velocity is the number of story points or items the team completes per sprint, tracked over time. The template includes a simple chart slide that plots velocity across the last six to ten sprints. This historical data is the most reliable input for sprint planning because it shows what the team actually delivers, not what it hopes to deliver. When a team consistently completes 30 story points per sprint, planning 45 points is not ambitious; it is a setup for failure. The velocity chart makes this visible and gives the team an objective basis for pushback when stakeholders request more than the team can deliver.
Capacity Calculator
Not every sprint has the same capacity. Holidays, vacations, on-call rotations, and training days all reduce the available time for feature work. The capacity slide asks the team to input each member's availability for the upcoming sprint as a percentage of full capacity. The template then shows total available capacity compared to the planned workload. If planned work exceeds available capacity, the visual flags the sprint as over-committed. This five-minute calculation at the start of sprint planning saves days of stress during the sprint itself.
Sprint Status Dashboard
During the sprint, the status dashboard provides a view of progress. Items move through columns: To Do, In Progress, In Review, and Done. A burndown or burnup chart shows whether the team is on pace to complete the sprint goal. The dashboard is designed for daily standups -- instead of asking each team member what they did yesterday, the team can review the board together and focus discussion on blocked items and at-risk commitments.
How to Use This Template
1. Start with the sprint goal
Before adding stories, define the sprint goal on the first slide. What is the team trying to achieve this sprint? Express it as an outcome, not a list of tasks. Good: "New users can complete onboarding in under 3 minutes." Bad: "Complete stories SPRINT-101 through SPRINT-115."
Why it matters: Starting with backlog items and working backward to a goal produces an incoherent sprint where unrelated items compete for attention. Starting with the goal produces a focused sprint where every item is in service of a shared outcome.
2. Add sprint stories and review velocity
Populate the story board with the user stories committed for this sprint. Include the story title, assignee, and point estimate. Group stories by theme or epic so the audience sees how individual stories contribute to larger objectives. Review the velocity chart from the last six sprints and plan the upcoming sprint to match the team's average velocity, adjusted for any capacity differences.
Why it matters: Velocity-based planning replaces optimism with evidence. Teams that plan based on historical throughput deliver on their commitments consistently, which builds trust with stakeholders and reduces burnout from chronic over-commitment.
3. Show capacity allocation
Update the capacity pie chart to show how the team's bandwidth is distributed: percentage going to new features, bug fixes, tech debt, and buffer for unplanned work. Input each team member's availability and account for holidays, vacations, on-call duties, and any non-sprint obligations.
Why it matters: A sprint planned at 100 percent capacity will fail if two team members are on vacation and a third is on-call for three days. The capacity calculator makes the true available time explicit so the team can plan accordingly.
4. Separate committed from stretch items
Mark the items that the team commits to completing and the items that are stretch goals. Communicate only the committed items to stakeholders. In Google Slides, use distinct card styling -- solid borders for committed, dashed borders for stretch -- to make the distinction visible during presentations.
Why it matters: The committed-versus-stretch distinction protects the team's credibility. Stakeholders learn to trust the committed forecast because it is met consistently. Stretch items provide upside when the sprint goes well without creating a sense of failure when they are not reached.
5. Close with review and retro
At the end of the sprint, update the review slides with what shipped versus what was committed. Add the retrospective findings -- what went well, what did not, and what the team will do differently next sprint. Save the completed deck as a record.
Why it matters: Retrospectives are the mechanism by which agile teams improve. Without them, the same problems recur sprint after sprint. Logging action items and reviewing them at the next retrospective creates accountability for follow-through. Over multiple sprints, these decks become a valuable history of team performance and process improvement.
When to Use This Template
This template is designed for agile teams running Scrum or Scrum-like processes with fixed-length iterations. If your team works in one-to-four-week sprints, holds sprint planning and review ceremonies, and tracks a product backlog, this template provides the structure to make those ceremonies effective and the progress visible. Google Slides turns sprint data into a presentation format ideal for stakeholders who want sprint-level visibility without attending daily stand-ups.
The sprint plan roadmap is particularly valuable for teams that need to show how sprint-level work connects to higher-level goals. Product managers and stakeholders often struggle to see how a list of JIRA tickets contributes to the quarterly roadmap. By anchoring each sprint to a goal and mapping that goal to a quarterly objective, this template provides the traceability that satisfies strategic leadership without burdening the team with excessive reporting.
This template is especially useful for teams that do formal sprint reviews with stakeholders, customers, or leadership present. The structured slide format ensures the review covers goals, accomplishments, and learnings -- not just a ticket-by-ticket walkthrough. It also works well for distributed or remote teams where sprint ceremonies happen over video calls. Having a shared visual deck keeps everyone focused and creates a tangible artifact from each sprint.
New agile teams benefit from this template as well. Teams transitioning from waterfall or ad-hoc planning often struggle with how much work to pull into a sprint, how to handle scope changes mid-sprint, and how to communicate progress. The velocity tracker, capacity calculator, and committed-versus-stretch model provide guardrails that help new teams avoid the most common pitfalls while they develop their agile muscle memory.