Quick Answer (TL;DR)
This free Google Slides swimlane roadmap template displays product work across parallel horizontal lanes -- one per team, product area, or strategic theme. It is the best format for visualizing how multiple workstreams progress simultaneously and where cross-team dependencies exist.
What This Template Includes
Why Use Google Slides for a Swimlane Roadmap
Swimlane roadmaps are inherently visual -- the spatial layout of parallel lanes with connecting arrows communicates information that no table or list can replicate. Google Slides gives you the design tools to create clean, readable swimlane visuals without specialized diagramming software.
The multi-lane format is particularly effective in presentations because it answers the question every executive asks when seeing a roadmap: "What is each team working on, and how does it connect?" A single swimlane slide replaces multiple team-specific roadmaps.
Google Slides also makes it easy to animate the swimlane view for progressive disclosure. Reveal one lane at a time during the presentation, building up the full picture. This keeps the audience engaged and prevents information overload from showing everything at once.
Template Structure
Swim Lane Configuration
The first decision in setting up a swimlane roadmap is choosing what each lane represents. The most common configuration uses one lane per team: Frontend, Backend, Mobile, Design, QA, and DevOps, for example. Alternative configurations include one lane per product area (Payments, Onboarding, Analytics), one lane per department (Engineering, Marketing, Sales, Support), or one lane per initiative when work cuts across organizational boundaries. In Google Slides, you can relabel lanes freely and experiment with different configurations until you find the one that reveals the most useful coordination information for your context. Use 3-6 lanes per slide for readability.
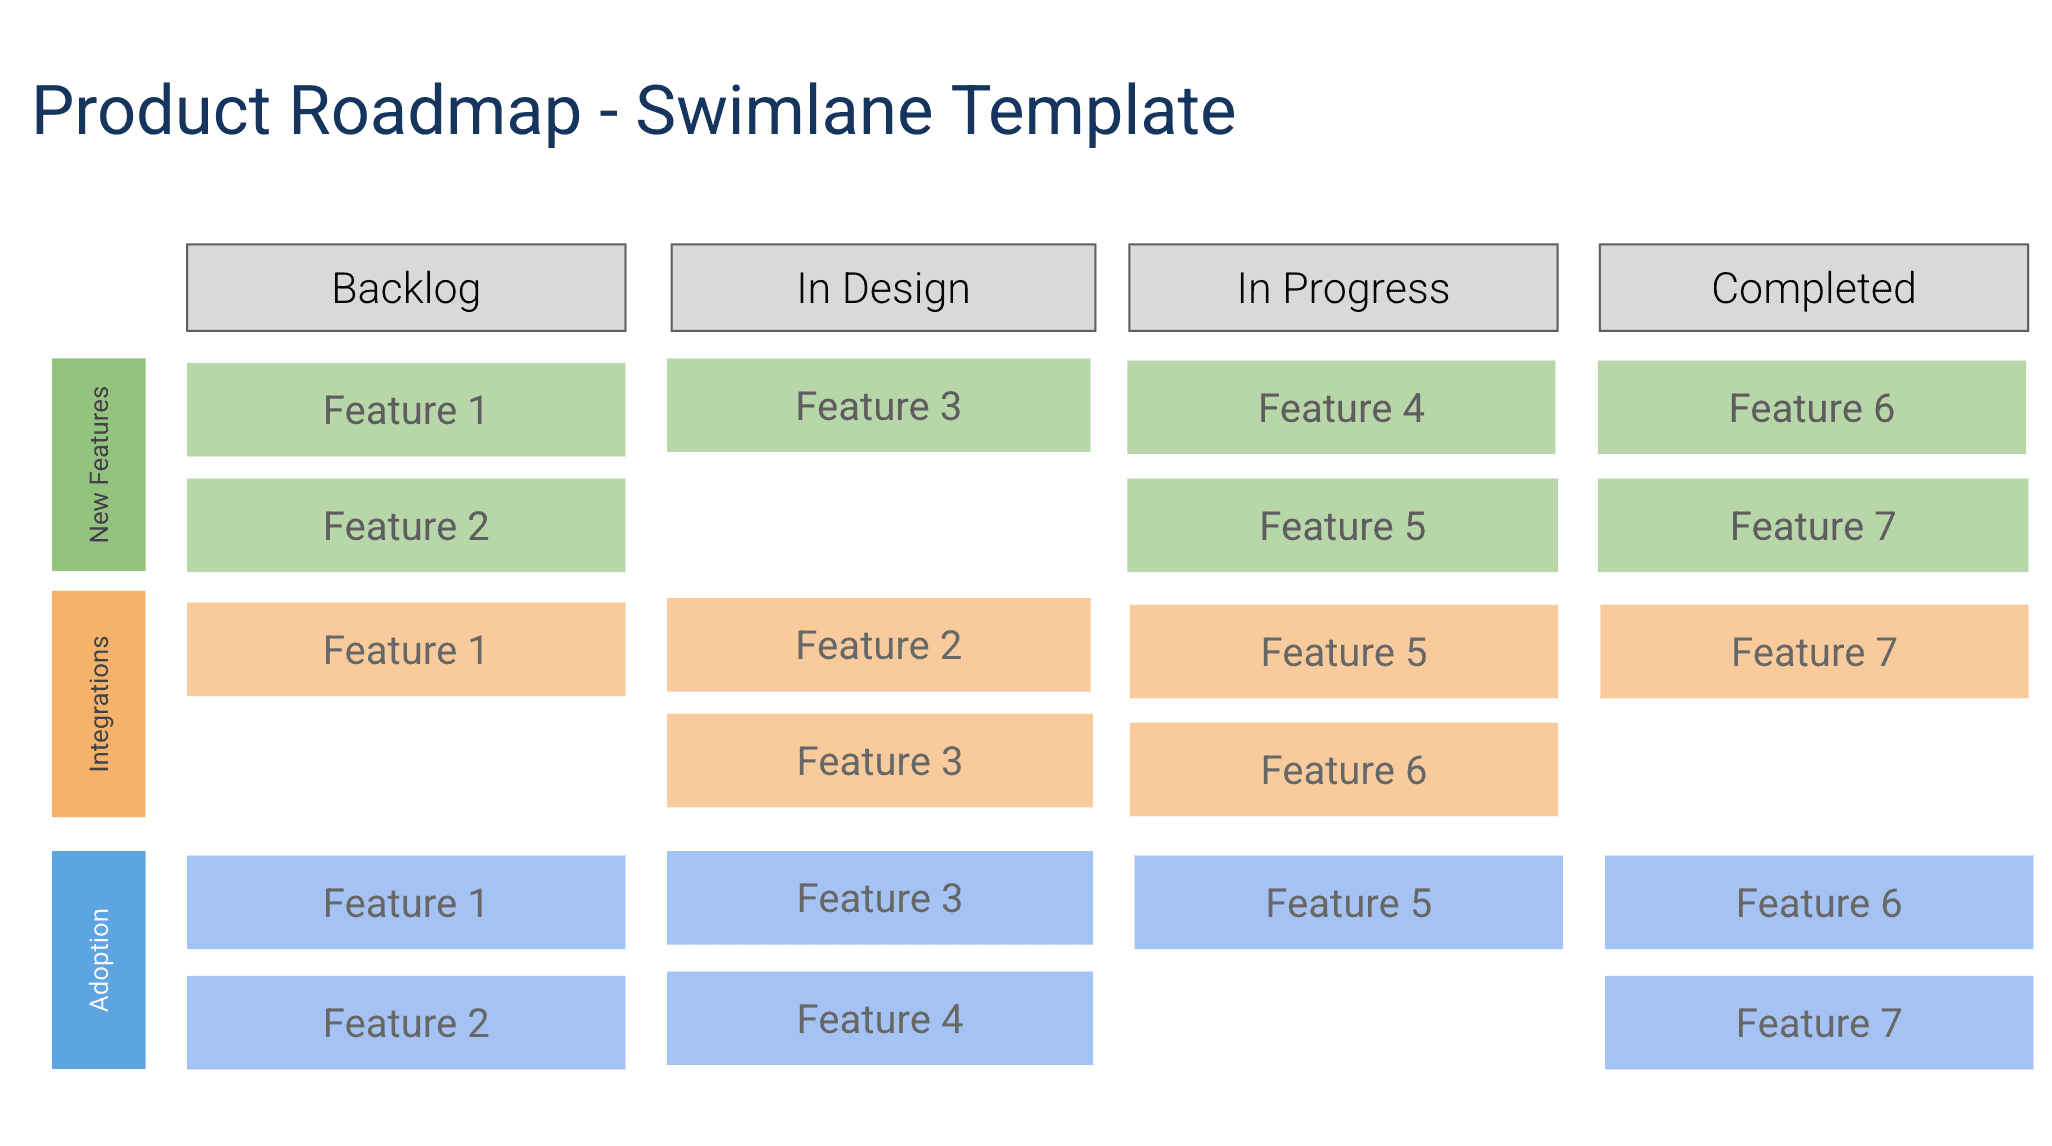
Work Items Within Lanes
Each lane contains the work items that the corresponding team or group owns. Work items are displayed as bars on the timeline, showing their start date, end date, and current status. The horizontal position of each bar communicates timing, so a glance at the roadmap shows whether two teams are working in parallel or in sequence. Within each lane, items can be stacked vertically to show concurrent work. If a lane has too many concurrent items, that visual density itself is a signal that the team may be overloaded.
Cross-Lane Dependencies
Dependencies are the reason swimlane roadmaps exist. A dependency connector is a line drawn from a work item in one lane to a work item in another lane, indicating that the second item cannot start or finish until the first is complete. For example, the Backend team's "API for new checkout flow" must be complete before the Frontend team's "Checkout UI" can begin integration testing. Drawing this dependency on the slide makes it visible to both teams and to leadership. In Google Slides, use arrow connectors and color-code them by risk: green for on-track, yellow for at-risk, red for blocked.
Bottleneck Detection
A bottleneck occurs when one lane becomes a constraint that slows all connected lanes. The template includes bottleneck indicators that flag lanes where work items are consistently delayed or where a high number of dependencies converge. For instance, if four different teams depend on the DevOps lane for infrastructure provisioning and DevOps has only two engineers, the swimlane roadmap will show four dependency arrows converging on a single lane, making the bottleneck impossible to ignore. This visibility is what drives staffing and prioritization decisions at the leadership level.
Executive Summary Row
Not every audience needs to see every lane in detail. The executive summary row sits at the top of the roadmap and displays a single aggregate status for each time period. It answers the question "Are we on track this month?" with a green, yellow, or red indicator derived from the health of the individual lanes below. Executives can scan the summary row in seconds and then drill into specific lanes only when the summary indicates a problem. This layered design makes the roadmap useful for both operators and leaders without requiring two separate documents.
How to Use This Template
1. Define your swim lanes
Make a copy and decide what each lane represents. Common choices: teams (Frontend, Backend, Mobile), product areas (Core, Growth, Platform), or strategic themes (Revenue, Retention, Efficiency). Use 3-6 lanes -- more creates visual clutter.
Why it matters: The lane structure determines what the roadmap makes visible. Choosing the wrong grouping produces a roadmap that obscures the very coordination problems it was meant to solve. Start with the grouping that matches where handoff friction is highest.
2. Add initiatives to each lane
Place initiative bars in the appropriate lane, aligned to the timeline. Each bar should show the initiative name and, optionally, the lead person. Keep it to 2-4 items per lane to maintain readability. Have each lane owner add their team's planned work items with start dates, end dates, and status.
Why it matters: The swimlane roadmap is only as useful as the data in it. If one lane is fully populated and another is empty, the roadmap cannot show dependencies or coordination issues. All lanes must be populated for the view to be valuable.
3. Draw cross-lane dependencies
Where one lane's work depends on another lane's deliverable, draw an arrow connecting them. Label the dependency with what is needed and by when. These cross-lane arrows are the most valuable part of a swimlane roadmap -- they make coordination requirements visible.
Why it matters: Cross-lane dependencies are the highest-risk elements in multi-team delivery. Making them explicit turns vague coordination assumptions into specific, trackable commitments. This is the step where the swimlane roadmap delivers most of its value.
4. Identify and address bottlenecks
Look for lanes where multiple dependencies converge or where work items are consistently red or yellow. Add shared milestone markers that span all lanes for events that affect everyone: product launches, company all-hands, major customer demos, or regulatory deadlines. Discuss bottlenecks in cross-team planning meetings and decide whether to add capacity, re-sequence work, or reduce scope.
Why it matters: Bottlenecks that are not addressed propagate delays across the entire roadmap. A one-week delay in a bottleneck lane can cause two-week delays in three downstream lanes. Early intervention saves multiples of the original delay.
5. Present lane by lane and update weekly
Walk through each lane, explaining the team's focus and how their work contributes to the overall product strategy. Then zoom out to discuss cross-lane dependencies and coordination challenges. End with shared milestones. Each lane owner should update their lane weekly, with a cross-team sync meeting of 30 to 45 minutes reviewing the full roadmap.
Why it matters: The swimlane roadmap is a coordination tool, and coordination requires regular communication. Weekly updates and syncs keep the roadmap accurate and ensure that cross-lane issues are discussed with all relevant parties in the room.
When to Use This Template
A swimlane roadmap is the right choice whenever multiple teams must deliver interconnected work on a shared timeline. This is common in product organizations with dedicated frontend, backend, mobile, and platform teams, where a single feature requires contributions from several groups. Without a swimlane view, each team manages its own plan independently, and cross-team dependencies are managed through ad-hoc Slack messages and meetings that do not scale. Google Slides makes this coordination visible in a presentation format ideal for program reviews and leadership updates.
This template is also valuable during large organizational initiatives such as platform migrations, product launches, or compliance programs. These efforts typically span engineering, design, marketing, legal, and operations. A swimlane roadmap with one lane per department gives the program lead a single view of all parallel workstreams and their interdependencies. The visual swimlane format communicates status more effectively and surfaces problems faster than spreadsheets or status emails.
Startups scaling from one team to multiple teams often discover the need for swimlane roadmaps for the first time. When a single team builds everything, coordination happens organically through daily conversation. When that team splits into two or three specialized groups, the conversation breaks down and dependencies start causing delays. The swimlane roadmap is the simplest tool that restores coordination visibility without introducing heavy project management overhead.
It is also the best format for program reviews where leadership wants to see the full breadth of product investment in a single view without drilling into individual team roadmaps. The Google Slides format is presentation-ready for these high-stakes meetings.